
For engineering leads and program managers building high-reliability products, a memory leak isn't just a bug; it's a critical operational risk. In systems where failure is not an option—from medical devices to industrial automation—these issues cause unpredictable field failures, gradual system degradation, and expensive product recalls. A slow, undetected memory leak in a long-running device is a ticking time bomb. The question isn't if it will fail, but when, and the business impact often far outweighs the upfront engineering cost of rigorous, automated detection.
This guide provides a practical, actionable playbook for engineering teams responsible for delivering stable, long-running embedded systems. It's for leaders who need a robust process for finding and fixing these insidious bugs before they reach a customer. We'll skip the generic definitions and focus on a repeatable approach for ensuring long-term system stability.
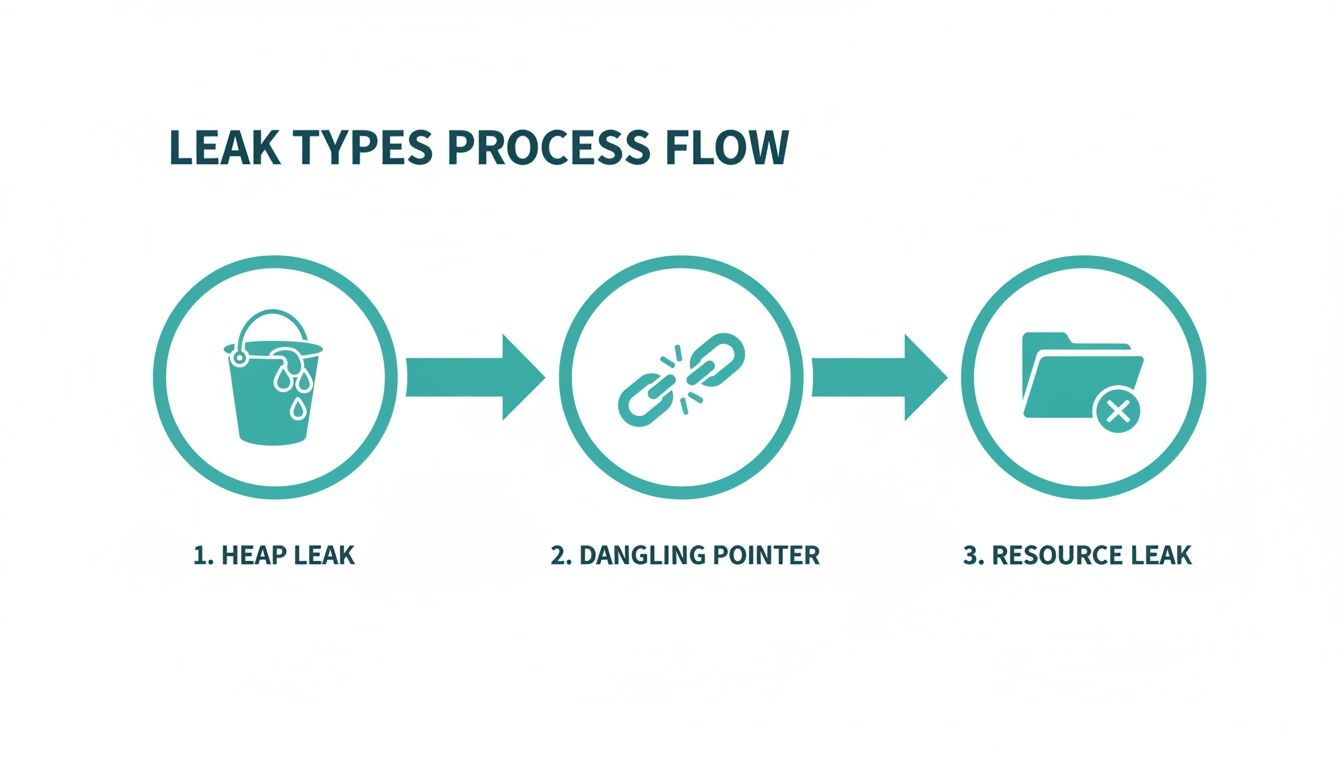
- Problem: Differentiate common leak types, from heap leaks to resource leaks and logical bloat.
- Diagnosis: Build a layered detection strategy combining static and dynamic analysis tools.
- Solution: Automate checks into your CI/CD pipeline to create a quality gate you can trust.
This approach is most critical for products with long operational lifespans or where field updates are difficult. It may be overkill for simple, short-lived consumer gadgets where a reboot is an acceptable fix.
The Operational Risk of Memory Leaks
The real challenge with memory leaks in embedded systems is that many are slow and subtle. They often surface only after hours, days, or even weeks of continuous operation—conditions that standard quality assurance test cycles rarely replicate. The strategies we'll outline are designed specifically for this reality, helping you build systems that remain stable not just for hours, but for their entire operational lifespan.
Before you can fix a memory leak, you must correctly identify its archetype. A simple "forgot to free" error is just one possibility. Each type of leak has its own signature, and recognizing it is the key to moving from chasing symptoms to performing a targeted, root-cause analysis. For those new to the field, our guide on what embedded systems engineering covers the foundational concepts that underpin reliable product development.
Let's break down the usual suspects.
The Slow Bleed: Classic Heap Leaks
The most common memory leak is the classic heap leak, a familiar issue for C/C++ developers. Your code allocates a chunk of memory from the heap—using malloc() or new—but then loses every pointer to that memory before it gets deallocated. That memory is now orphaned. The system thinks it's still in use, but your program has no way to access or free it.
A simple pointer reassignment is all it takes:
void cause_heap_leak() {
    // Allocate memory for a large data structure
    char* buffer = new char[1024];
    // ... some operations happen ...

    // OOPS: The original buffer is now orphaned.
    // A new memory block is allocated, and its address overwrites the old one.
    buffer = new char[1024];

    // We only free the second block; the first one is leaked forever.
    delete[] buffer;
}
The symptom is a slow, steady increase in memory usage. Over time, performance degrades, response times increase, and eventually, the system crashes with an out-of-memory error.
The Landmines: Dangling Pointers and Use-After-Free
A far more chaotic problem is the dangling pointer. This occurs when you free a block of memory, but another pointer in your code still holds that old address. This isn't a leak in the traditional sense—the memory is technically free—but the pointer is now a ticking time bomb.
Using that pointer leads to "undefined behavior," which often means bizarre data corruption and crashes that seem completely unrelated to the original bug.
void create_dangling_pointer() {
    char* ptr = new char[256];
    delete[] ptr; // Memory is freed.

    // DANGER: ptr is now a dangling pointer.
    // Writing to this memory corrupts the heap, stomping on whatever is there now.
    ptr[0] = 'A';
}
These are among the toughest bugs to track down because the system might seem to work correctly until the freed memory block is reallocated and used by another part of your program.
The Hidden Consumers: Resource Leaks and Memory Bloat
Memory isn't the only thing that can leak. Resource leaks happen when a program fails to release system-level resources like file handles, network sockets, mutexes, or threads. In 2021, a high-profile memory leak in VS Code was traced to a process handle leak on Windows, where OpenProcess was called without a matching CloseHandle. Each unclosed handle consumed system memory, leading to a runaway situation.
The symptoms of a resource leak might not look like a traditional memory leak. You might see the system refusing to open new files or establish network connections long before total memory exhaustion. It’s a crucial distinction for accurate diagnosis.
Finally, there is the subtle problem of memory bloat, also known as a logical leak. Here, the memory is still technically reachable by the program, but it's functionally useless. Think of objects being added to a global cache or a long-lived collection but never being removed, even after they're obsolete. Because a valid reference still exists, tools like Valgrind might not flag it as a leak, and a garbage collector in a language like Java or C# can't reclaim the memory. All you see is a steady increase in your application's memory footprint with no obvious cause.
Decision Aid: Matching Symptoms to Leak Types
This table provides a quick reference for connecting the type of leak with the symptoms you're likely to see, helping you narrow the diagnosis.
| Leak Archetype | Description | Common Language | Typical Symptom |
|---|---|---|---|
| Heap Leak | Memory is allocated on the heap but all pointers to it are lost before it's freed. | C, C++, Rust | A slow, linear increase in memory usage over time, eventually leading to a crash. |
| Dangling Pointer | A pointer continues to reference a memory location that has already been deallocated. | C, C++, Rust | Intermittent, "heisenbug" crashes; data corruption that seems unrelated to the cause. |
| Resource Leak | System resources (file handles, sockets, threads, etc.) are acquired but never released. | Any Language | System-wide resource exhaustion (e.g., "too many open files"), not just memory pressure. |
| Memory Bloat (Logical Leak) | Memory is still referenced and technically reachable but is functionally useless to the program. | Java, .NET, Python | A gradual increase in the application's memory footprint that doesn't decrease, even when idle. |
Recognizing which of these patterns fits your situation is the first and most critical step. It narrows down the search space and points you toward the right tools for finding the root cause.
A Layered Strategy for Leak Detection
Relying on a single tool to find memory leaks is a recipe for failure. A resilient strategy involves a layered, defense-in-depth approach that blends different types of analysis to catch problems at every stage, from code authoring to final integration testing. This aligns with a core Sheridan principle: implement verification discipline early to prevent costly downstream failures.
First Line of Defense: Static Analysis
The first and fastest feedback loop is static analysis. These tools act as tireless, automated code reviewers, scanning your source code without running it to find patterns that indicate potential memory issues. A robust process for quality assurance in software development requires static analysis as a foundational component.
Tools like the Clang Static Analyzer, PVS-Studio, or commercial options like Coverity are indispensable. They parse your codebase and trace every allocation and release path. They’re especially good at finding:
- Unreleased memory: Spotting
mallocornewcalls that lack a matchingfreeordeleteon every possible execution path. - Potential resource leaks: Identifying an unclosed file handle from
fopenor a mutex that was never unlocked.
By integrating static analysis directly into IDEs or pre-commit hooks, you turn potential bugs into immediate learning opportunities, preventing simple mistakes from ever entering the main branch.
However, static analysis isn't a silver bullet. It can produce false positives and lacks visibility into dynamic, runtime behavior. Complex data-dependent logic or leaks buried in third-party libraries often slip through.
Second Line of Defense: Dynamic Analysis
Dynamic analysis tools watch your application as it runs, observing its memory interactions in real-time. This is how you catch the subtle, complex leaks that static analysis can't see. For C/C++ development, AddressSanitizer (ASan) and Valgrind are pillars of this approach.
AddressSanitizer (ASan) is a fast, compiler-based memory error detector built into GCC and Clang. To use it, simply add a flag during compilation:gcc -g -fsanitize=address my_program.c -o my_program
When you run the compiled program, ASan instruments every memory access. Its typical 2x performance slowdown is often acceptable for running entire unit and integration test suites. If ASan spots a leak, it terminates the program and prints a detailed report, including the full stack trace showing where the leaked memory was allocated.
Valgrind's Memcheck is another powerful tool, but it operates differently by running your unmodified binary inside a virtual machine. This allows it to catch a wider array of memory errors but at a steep performance cost—often a 20-50x slowdown. While too slow for large-scale test suites, its thoroughness is unmatched for focused debugging of a specific component.
Operating Scenario: DVT Under Pressure
Imagine an industrial IoT company integrating a new cellular modem into a remote monitoring device. The team of five firmware engineers is deep in the DVT phase, with a hard deadline for field trials just three weeks away. All integration tests are passing, but during a 45-minute stability test, an engineer notices the main control process's memory usage is creeping up by a few kilobytes every minute.
Instead of dismissing it as noise, the lead engineer reruns the test suite with the application compiled with ASan. The stability test fails within 10 minutes, generating a detailed leak report. The stack trace points directly to a function inside the modem's third-party library responsible for handling network status updates. A small event object was being allocated on every update but was never freed.
Without this layered approach, that slow leak would have gone unnoticed until long-duration field trials. It would have inevitably crashed the device after days of operation, forcing a nightmare of remote debugging and jeopardizing the trial schedule. For those tackling similar low-level hardware challenges, our guide on debugging with JTAG offers more tactics for your arsenal. By catching this bug early in DVT, the team prevented a critical field failure and kept the program on track.
Automating Leak Detection in Your CI Pipeline
Manually hunting for memory leaks is an inefficient strategy that relies on diligence and luck. The only truly effective approach is to make leak detection a systematic, non-negotiable part of your development process by automating it within your Continuous Integration (CI) pipeline. This transforms leak detection from a sporadic debugging exercise into a consistent quality gate.
Building a Dedicated Test Harness for Memory Analysis
The core of this strategy is a test harness designed for memory analysis. These aren't standard unit tests. To catch real-world leaks, you need tests that simulate the long-term operational stress your system will face:
- Stress Tests: Push your system to its limits by hammering every feature and API under heavy load, forcing corner-case allocations and deallocations.
- Soak Tests (Endurance Tests): Simulate continuous, steady-state operation for hours or even days. These are essential for finding slow, insidious leaks that are invisible in short test cycles.
By building these tests into your CI pipeline, you ensure every code change is rigorously validated for memory stability. You can see how these practices fit into a larger strategy in our overview of embedded firmware development services.
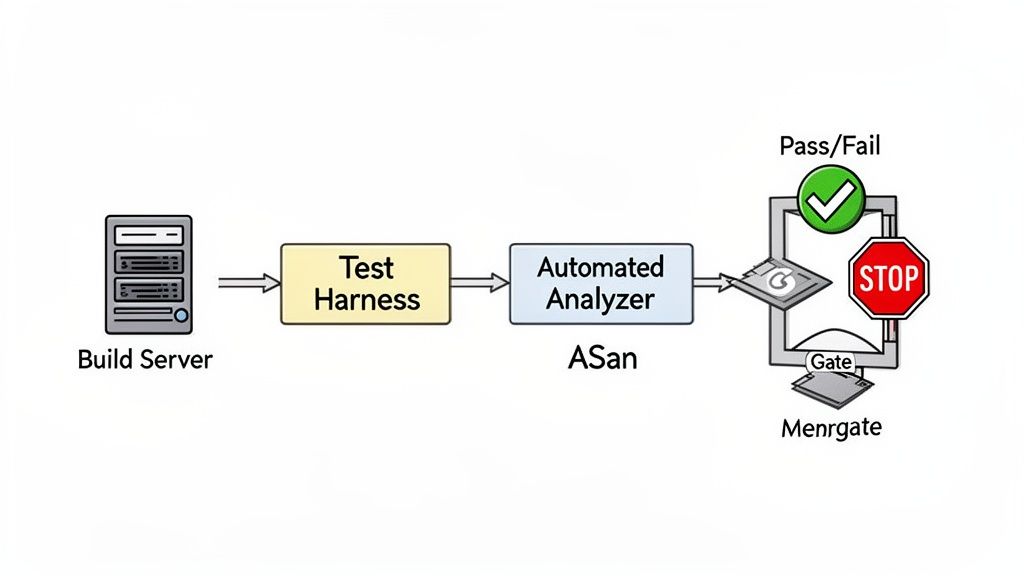
Scripting the CI Job as a Quality Gate
With the test harness ready, script the dynamic analysis tools to run within the CI job. Whether using GitLab CI, Jenkins, or GitHub Actions, the concept is the same. You'll configure a pipeline stage that builds the application with instrumentation flags (like -fsanitize=address for ASan) and then runs your stress and soak tests against that binary.
A critical part of the setup is configuring the CI job to automatically fail the build if a leak is detected. Most memory sanitizers return a non-zero exit code when they find a problem, which CI runners interpret as a failure. This creates a hard gate that prevents bad code from moving forward.
This isn't a new idea. Back in 2011, researchers presented an automated JVM leak detection method for cloud applications with only 2% runtime overhead, proving the viability of automated, low-impact monitoring.
Here’s a simplified configuration for a .gitlab-ci.yml file:
memory-leak-test:
  stage: test
  script:
    # Build with AddressSanitizer enabled
    - gcc -g -fsanitize=address -o my_app my_app.c
    # Run the long-duration soak test
    - ./run_soak_test.sh my_app
  rules:
    # Run this job on every commit to the main branch
    - if: '$CI_COMMIT_BRANCH == "main"'
This job ensures every commit targeting the main branch is scrutinized. If run_soak_test.sh triggers an ASan error, the pipeline fails, the merge is blocked, and the developer gets immediate notification. This tight feedback loop is essential for maintaining high code quality and preventing memory-related field failures.
Monday Morning To-Do List: Implementing Your Detection Strategy
Theory is useful, but execution is what matters. Here is a practical playbook for creating a robust process to eliminate memory leaks before they threaten your product's reliability. This isn't about a one-off bug hunt; it's about building a durable system for prevention.
Immediate Actions for Your Team (This Week)
These practices provide the fastest feedback and will have the most immediate impact on code quality.
- Conduct Focused Code Reviews: Mandate that every code review explicitly scrutinizes resource ownership patterns. For C++ developers, this means enforcing the use of RAII constructs like
std::unique_ptrandstd::shared_ptrover raw pointers and manualnew/deletecalls. - Integrate a Static Analyzer into Pre-Commit Hooks: This is your easiest win. Get a tool like the Clang Static Analyzer running as part of your pre-commit hooks. This gives developers immediate, private feedback and stops simple mistakes from ever polluting the main branch.
Building Your Automated Safety Net (This Month)
Once you've handled the low-hanging fruit, build the automated system that catches what manual reviews will inevitably miss.
The goal is to make memory safety a byproduct of your process, not the result of some heroic, late-night debugging session. When your CI pipeline automatically fails a build because of a potential leak, you’ve successfully shifted from reactive firefighting to proactive quality control.
- Deploy Instrumented CI Jobs: Set up a dedicated job in your CI pipeline that builds your application with AddressSanitizer (ASan) enabled. This job must trigger a long-duration system test—a "soak test"—that simulates hours of continuous operation to coax slow, creeping leaks out of hiding.
- Establish a Memory Baseline in Staging: Before any deployment, use a low-overhead profiler in a staging environment that mirrors production. This establishes a clear baseline of your application's memory footprint under normal load. Any unexplained rise from this baseline is your earliest and most critical warning sign of a problem.
The impact of this kind of monitoring can't be overstated. Some reports show that memory leaks contribute to a staggering 22% of all outages in microservices-based architectures, often going unnoticed until memory is 50-70% exhausted. By tracking memory usage under real-world conditions, engineering teams can fix these issues long before they trigger a catastrophic failure, as detailed in this analysis of how modern tools prevent these production outages on in-com.com.
Where This Strategy Breaks Down (Risks and Tradeoffs)
This layered approach is powerful but not foolproof.
- Performance Overhead: While ASan is fast, its 2x slowdown can still be too much for timing-sensitive hard real-time systems. In these cases, you may need to rely more heavily on static analysis and targeted hardware-in-the-loop (HIL) tests.
- Third-Party Libraries: Dynamic analysis can flag leaks inside binary-only third-party libraries, but you can't fix them. Your only recourse is to report the issue to the vendor and potentially seek an alternative.
- Complex Logical Leaks: Automated tools are excellent at finding heap and resource leaks but often struggle to identify logical leaks (memory bloat), which still require manual profiling and deep application knowledge.
Making memory management a shared, team-wide responsibility is the only path to long-term product reliability.
Common Questions on Memory Leak Detection
Here are answers to common questions our engineering teams encounter when diagnosing memory bugs.
How do memory leaks differ from buffer overflows?
It’s easy to confuse these two, but they have fundamentally different impacts.
- A memory leak is a resource issue. The program allocates memory but loses all references to it, making it impossible to free. This slowly drains available memory, attacking system availability.
- A buffer overflow is a security vulnerability. The program writes data past the end of an allocated buffer, overwriting adjacent memory. This can cause a crash, corrupt data, or allow an attacker to execute malicious code, compromising system integrity.
Can garbage-collected languages have memory leaks?
Yes, absolutely. While a garbage collector (GC) in languages like Java, Python, or C# automates cleanup, you can still suffer from logical memory leaks. This happens when you keep references to objects that are no longer needed, such as in a global cache that is never pruned. Because the objects are still technically "reachable," the GC sees them as in-use and won't reclaim the memory.
What is the first tool to use for a suspected leak?
For a suspected leak on a Linux or macOS development machine, your best first move is almost always AddressSanitizer (ASan). It’s built into modern compilers like GCC and Clang, and its performance overhead is low enough to run with your entire test suite, a huge advantage over slower tools like Valgrind. Just compile with the -fsanitize=address flag and run your tests. If ASan finds a leak, it provides a clean report pointing to the origin of the leaked allocation, making it an incredibly efficient starting point for your investigation.
At Sheridan Technologies, we specialize in diagnosing and solving complex issues in embedded systems, from subtle memory leaks to full-scale program rescue. Our integrated approach to hardware and firmware development ensures your product is reliable from architecture to production.
If you're facing persistent reliability challenges, request a design review with our experts.