
Tolerance stack up analysis is the engineering discipline of calculating how dimensional variation in individual components accumulates in an assembly. For technical leads and program managers, it's the predictive tool used to answer a critical, high-stakes question before committing to expensive tooling: Will these parts fit together reliably on the production line? Mismanaged tolerances are a primary source of late-stage production failures, costly rework, and schedule delays that can derail a hardware program. An inability to control fit and finish can lead to scrapped inventory, line-down situations, and significant budget overruns.
This guide is for engineering VPs, program managers, and lead engineers responsible for delivering complex hardware on schedule and within budget. It applies when you're moving from a prototype to a manufacturable design, especially for products with tight mechanical interfaces, multiple suppliers, or high-reliability requirements. This is a core practice of Design for Manufacturing (DFM). The goal is to move from "I hope it fits" to "I have the data to prove it will fit," directly connecting engineering decisions to business outcomes like reduced risk and lower unit cost.
This guide provides a framework to help you:
- Choose the right analysis method for your project's risk profile.
- Integrate tolerance analysis into your product development lifecycle.
- Avoid common pitfalls that lead to assembly failures on the factory floor.
Decision: Choosing the Right Tolerance Analysis Method
Selecting the right tolerance analysis method is a critical decision that balances manufacturing cost, assembly yield, and product risk. Your choice directly influences how tightly individual components must be toleranced, which in turn drives part cost and manufacturing complexity. The decision hinges on the assembly's complexity, the consequences of failure, and the volume of production. The three primary methods are Worst-Case analysis, Root Sum Square (RSS) analysis, and Monte Carlo simulation. Each serves a different purpose, from guaranteeing fit in critical applications to optimizing cost in high-volume production.
Comparison of Tolerance Analysis Methods
| Method | Principle | Best For | Key Advantage | Key Disadvantage |
|---|---|---|---|---|
| Worst-Case (WC) | Arithmetic sum of all tolerances. Assumes every part is at its dimensional extreme. | Critical applications (medical, aerospace) where failure is not an option; simple 1D stacks. | 100% certainty. If it passes, the parts will always fit. | Often leads to over-engineering and unnecessarily tight, expensive tolerances. |
| Root Sum Square (RSS) | Statistical sum (square root of the sum of squared tolerances). Assumes normal distribution. | High-volume production where some risk is acceptable; cost-sensitive designs. | More realistic, allowing for looser, cheaper tolerances while maintaining high yield. | Assumes a stable, normally distributed manufacturing process, which may not be true. |
| Monte Carlo Simulation | Computational simulation. Randomly "builds" thousands of assemblies based on distributions. | Complex 3D assemblies; non-normal distributions; when optimizing cost vs. yield. | Deepest insight. Predicts yield rates and identifies key dimensional contributors to failure. | Requires specialized software and more setup time; results are only as good as the input data. |
Recommendation: The Tiered Approach
For most hardware programs, a single method is insufficient. The most effective strategy is a tiered approach:
- Start with Worst-Case (WC): Use WC analysis on all critical interfaces early in the design phase. A "fail" verdict is a hard stop, indicating a fundamental architectural problem that must be addressed by redesigning parts or opening up nominal gaps.
- Move to RSS for Cost Optimization: If an assembly fails WC analysis but is not safety-critical, use the RSS method. This provides a more realistic, statistical assessment of fit. A "pass" at ±3σ (99.73% confidence) often justifies loosening tolerances, which is a direct path to reducing part cost. This is the most common path for consumer and industrial electronics.
- Employ Monte Carlo for Complex or High-Risk 3D Assemblies: For geometrically complex 3D stacks or when you need to precisely model non-normal distributions (e.g., from tool wear), Monte Carlo simulation is the gold standard. It allows you to model real-world manufacturing outputs and perform what-if scenarios to balance cost against predicted yield.
Risks and Where This Breaks Down
This tiered recommendation depends on several factors:
- Process Control: Statistical methods like RSS and Monte Carlo assume your supplier's manufacturing processes are stable and understood. If you lack process capability data (Cpk) or are working with an unproven supplier, the statistical assumptions may be invalid, making WC analysis the only safe option.
- Data Quality: The output of any analysis is only as good as the input. Using generic textbook tolerances instead of actual supplier data can create a false sense of security.
- Criticality: For life-safety systems, such as those found when designing medical devices, the minuscule risk of failure tolerated by statistical methods may be unacceptable. In these cases, the design must pass a worst-case analysis, even if it drives up cost.
A seminal 1995 report highlighted how worst-case analysis often led to over-design, forcing tolerance tightening that could spike part costs by 50-100%. In contrast, methods like RSS and Monte Carlo, which stack variations statistically at ±3σ, enabled looser tolerances while keeping assembly success rates above 99.73%. You can dive into the details in the original research on tolerance stacking methods.
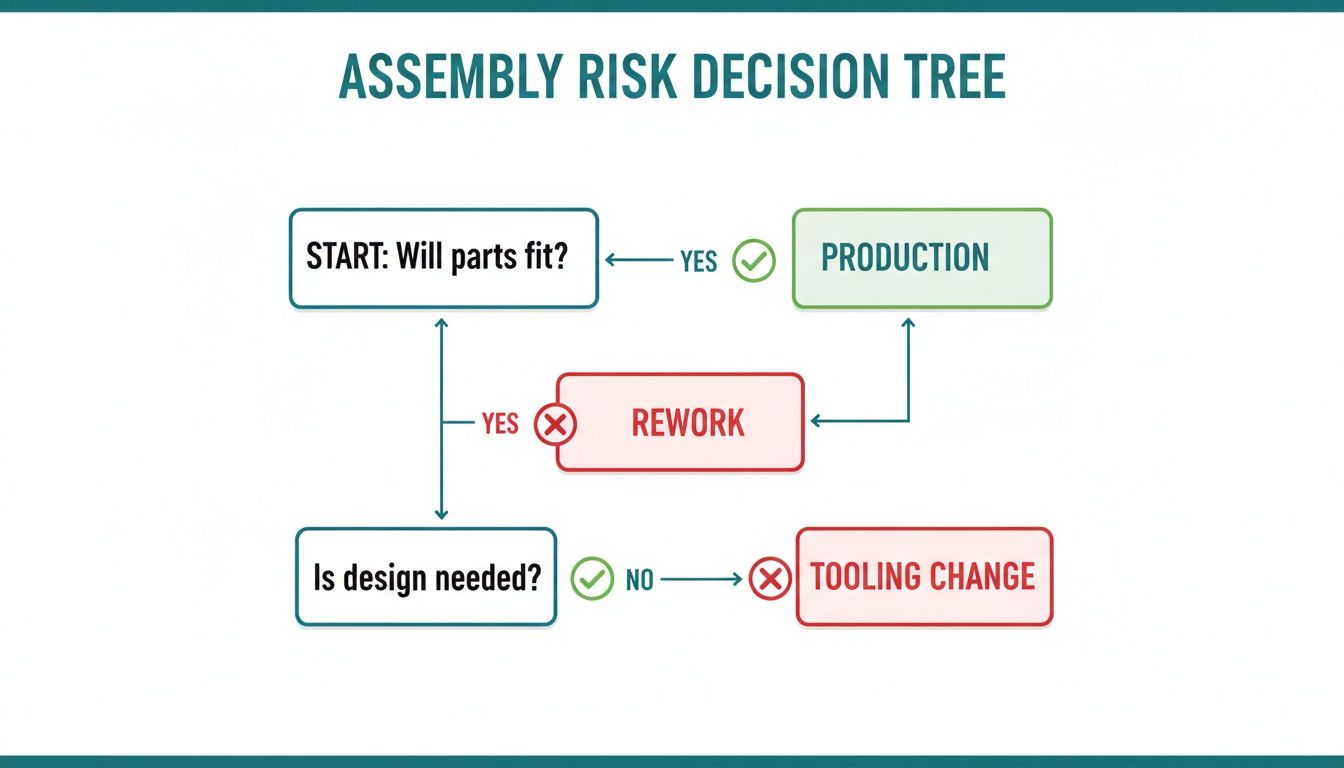
This decision tree illustrates the process: an initial analysis determines if the parts will fit. A "no" forces a choice between costly fixes or accepting a certain level of production failure, underscoring the value of performing this analysis before tooling is released. Success hinges on reliable inputs, which requires precision with measurement tools to validate part dimensions.
Operating Scenario: PCB Fit in a Medical Handheld Device
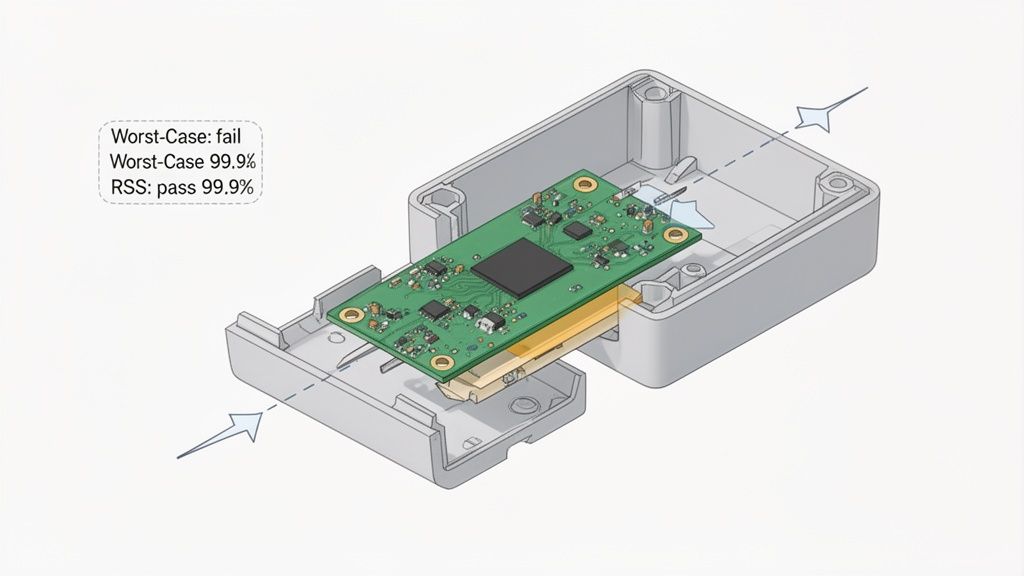
Let's apply this to a realistic scenario. A team is in the EVT (Engineering Validation Test) phase for a new portable diagnostic device. They are under pressure to release the plastic enclosure design for tooling, a $50,000 investment with an 8-week lead time. The critical interface is the fit of the main PCB inside the two-part injection-molded housing. A loose fit could cause intermittent connection failures if the device is dropped, while an interference fit will halt the assembly line.
The Goal: Ensure the final gap between the PCB and an internal enclosure rib is between 0.10mm (to prevent stress) and 0.90mm (to prevent rattle and shock failure).
The Problem: Defining the Dimensional Stack
The assembly involves a simple 1D stack-up of three components:
- Enclosure Base (A): An injection-molded plastic housing.
- PCB (B): A standard fabricated circuit board.
- Enclosure Top (C): The second molded part with the internal positioning rib.
The dimensional chain is: Gap = A - B - C.
Based on discussions with manufacturing partners, the team establishes the following achievable tolerances:
- Dimension A (Base Interior): 50.00 mm ±0.30 mm (Standard injection molding)
- Dimension B (PCB Width): 49.00 mm ±0.15 mm (PCB fabrication standard)
- Dimension C (Top Rib): 0.50 mm ±0.10 mm (Injection molding)
Diagnosis: Running the Numbers
With the dimensional chain defined, the team runs both Worst-Case and RSS analyses.
1. Worst-Case (WC) Calculation: This assumes a "perfect storm" of unfavorable dimensions.
- Max Gap = A_max – B_min – C_min = 50.30 – 48.85 – 0.40 = 1.05 mm
- Min Gap = A_min – B_max – C_max = 49.70 – 49.15 – 0.60 = -0.05 mm
Outcome: The WC analysis predicts a gap range of -0.05 mm to 1.05 mm. This is an immediate failure. The -0.05 mm indicates a potential interference fit where the parts won't assemble, and the 1.05 mm gap is too large, risking board rattle. Based on this, the design is not ready for tooling release.
2. Root Sum Square (RSS) Calculation: This provides a more statistically probable outcome.
The statistical tolerance (T_stat) is calculated as:
T_stat = √(T_A² + T_B² + T_C²) = √(0.30² + 0.15² + 0.10²) = √0.1225 = ±0.35 mm
The nominal gap is 50.00 – 49.00 – 0.50 = 0.50 mm.
Applying the statistical tolerance gives a predicted gap range of 0.50 mm ± 0.35 mm, or 0.15 mm to 0.85 mm.
Outcome: The RSS result falls perfectly within the required [0.10 mm, 0.90 mm] window. This analysis predicts that over 99.73% of assemblies will be in spec.
The Decision and Business Impact
The team is now at a classic engineering decision point. The WC analysis says the design is a failure, while the RSS analysis says it's perfectly acceptable for high-volume production.
- Option 1 (Satisfy WC): Tighten the enclosure tolerance from ±0.30 mm to ±0.15 mm. The supplier quotes a 20% increase in part cost and warns of lower yields for the housing itself. This would add thousands to the program cost.
- Option 2 (Trust RSS): Proceed with the current design and tolerances, accepting the statistically tiny risk (less than 0.27%) of an assembly falling out of spec.
Given that this is a portable device but not a life-sustaining implant, the team, in consultation with the program manager, decides to trust the RSS analysis. They are making a data-driven decision to avoid over-engineering, saving both tooling complexity and recurring part cost. They document this analysis and the decision as part of their EVT design review gate. This exact tension between absolute certainty and cost-effective manufacturability is why a disciplined, data-driven approach to DFM is essential.
In one compelling case study, a student engineering team found that while their worst-case analysis showed a design was viable, the RSS method confirmed a rejection rate of less than 1 part per million (PPM). This gave them the confidence to loosen non-critical tolerances, cutting manufacturing costs by an estimated 15% without compromising the final fit. You can read more in this paper on tolerance analysis in capstone projects.
Monday-Morning Usefulness: Practical Next Steps
Tolerance analysis isn't a one-time task but a continuous process woven into the product development lifecycle. Treating it as a late-stage checkbox is a recipe for discovering expensive problems when tooling is locked and deadlines are imminent.
This "prototype-to-production" mindset, a core Sheridan Technologies principle, is about making informed decisions early and refining them with empirical data.
1. During Concept/Architecture
- What to do: Create simple 1D stack-up spreadsheets for the most critical interfaces.
- Goal: Use worst-case analysis to validate fundamental architectural choices. Is the proposed layout inherently risky? Can parts be consolidated to simplify a dimensional chain? This is your cheapest opportunity to spot a doomed design path.
2. During EVT (Before Tooling Release)
- What to do: Perform detailed 1D and 2D analyses for all critical assemblies. Begin tolerance budgeting, allocating variation across components.
- Goal: Get a "go/no-go" decision before committing to expensive hard tooling. Your analysis documentation should be a mandatory deliverable for the EVT design review, proving the design is manufacturable. This is the time to have detailed conversations with suppliers about their process capabilities.
3. During DVT (With First Articles)
- What to do: Use measurement data from your First Article Inspection (FAI) reports to update your statistical models.
- Goal: Replace assumptions with real-world data. Did the molder hold a tighter tolerance than expected? Was the PCB more variable? Use this empirical data to refine your RSS or Monte Carlo models and adjust tolerances where necessary. This is where you validate your earlier analysis.
4. During PVT and Production Ramp
- What to do: Identify the dimensions that contribute most to variation (your Key Process Control characteristics, or KPCs). Monitor these dimensions on the factory floor using Statistical Process Control (SPC).
- Goal: Use your tolerance model as a quality control baseline. When assembly yield dips, the model provides a diagnostic map to quickly pinpoint the likely cause, enabling a faster resolution with your supplier. This discipline is essential for managing the complete product development lifecycle stages.
Common Failure Modes and How to Avoid Them
A tolerance analysis can go wrong if the inputs are flawed or the scope is too narrow. These common mistakes can turn a risk-reduction tool into a source of false confidence.
A successful stack-up requires a systems-level view that accounts for manufacturing reality and environmental conditions.
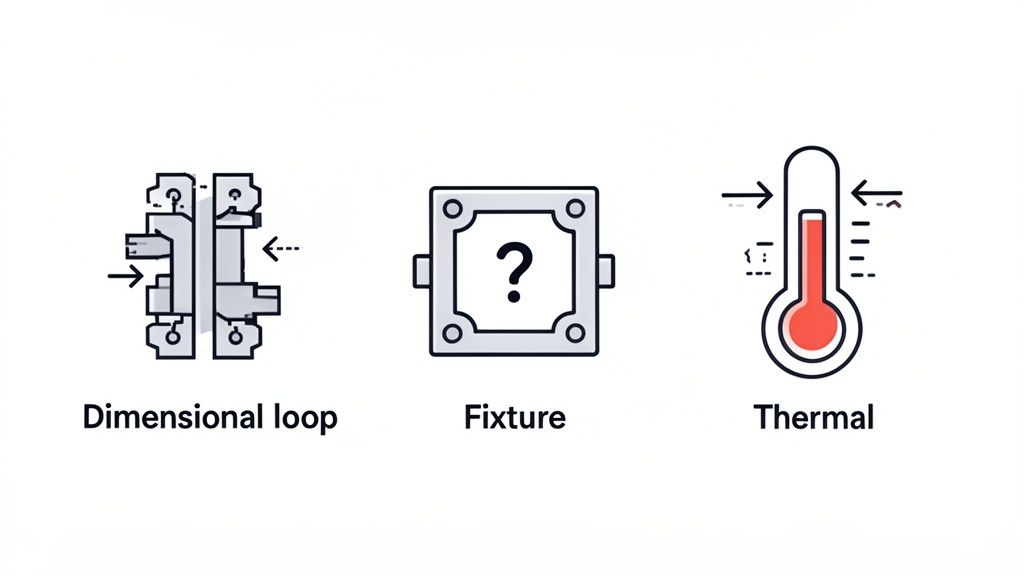
1. Incorrectly Defining the Dimensional Loop
This is the most fundamental error. If you misidentify which components are in the stack-up or trace the wrong path, the entire analysis is invalid.
- Failure Mode: An engineer analyzes a bolted joint but omits the bolt head and nut from the dimensional chain, leading to an incorrect prediction of clamping force.
- How to Avoid It: Always get a second set of eyes on your dimensional loop definition. Have another engineer who is not deep in the design trace the path. This simple peer review is the best defense against a flawed setup.
2. Making Flawed Statistical Assumptions
Statistical methods are powerful but depend on good data. Blindly assuming a perfect normal (Gaussian) distribution for every dimension is a common trap.
- Failure Mode: A CNC machining process exhibits tool wear, causing dimensions to skew larger over a production run. An RSS analysis based on a normal distribution will fail to predict the increased rate of interference fits that occur late in the run.
- How to Avoid It: Talk to your suppliers. Ask for actual process capability data (Cpk, Ppk). Use measurement data from your DVT builds to understand the actual statistical distribution of your parts. If you have no data, be conservative and stick with a worst-case analysis.
3. Forgetting Environmental and Assembly Factors
A part's dimensions on a drawing are not static; they change with temperature, load, and assembly methods. Ignoring these is a critical oversight.
- Thermal Expansion: An aluminum chassis inside a steel enclosure will expand at different rates. An analysis done only at room temperature will miss a potential interference fit at the product's maximum operating temperature.
- Fixture Tolerances: The fixtures used for assembly have their own tolerances, which contribute to the final stack-up. If your analysis only includes part tolerances, you're missing a significant source of real-world variation.
- How to Avoid It: Your analysis must account for the full operational context. Include thermal expansion calculations for dissimilar materials. Model deformation from press-fits or torquing. Add an allowance for fixture variation in your tolerance budget. This "manufacturing realism" is non-negotiable.
Manufacturing data suggests that poor tolerance management can be responsible for 20-30% of assembly rework costs. Across U.S. industries, the cost exceeds $10 billion annually. In one documented case, moving from worst-case to RSS analysis enabled a targeted redesign that cut component costs by 18%. You can learn more about how statistical analysis reduces program risk on gd-prototyping.com.
Answering Your Top Tolerance Analysis Questions
Even with a solid process, practical questions arise when applying these principles. Here are answers to common queries from engineering teams.
What's the Right Software for Tolerance Stack-Ups?
For a simple 1D stack, a well-organized spreadsheet is often the best tool. It's fast, accessible, and forces you to understand each link in the dimensional chain.
For complex 2D and 3D analyses involving Geometric Dimensioning and Tolerancing (GD&T), you need a dedicated CAD-integrated tool. These platforms are built to handle complex geometry and multiple variation sources.
Industry-standard tools include:
- CETOL 6σ by Sigmetrix: A powerful tool for solving complex 3D variation problems, known for its deep integration with major CAD systems.
- Variation Analysis (VSA) within Siemens NX: A sophisticated tool embedded in the NX environment for predicting the impact of manufacturing variation on assembly quality.
- 3DCS Variation Analyst: A flexible, widely used software that integrates with CATIA, SOLIDWORKS, and Creo, suitable for teams with diverse toolchains.
Key Takeaway: The tool is only as good as the engineer using it. A strong grasp of GD&T, dimensional chains, and statistical principles is more critical than the specific software. The tool should aid, not replace, sound engineering judgment.
How Can I Get Realistic Manufacturing Tolerance Data?
Your analysis is meaningless without realistic inputs. Never rely solely on generic tolerance tables from a textbook.
- Talk to Your Suppliers: This is the most critical step. Early in the design process, show your manufacturing partners the critical features and ask for their standard process capabilities for the specific materials and machines they will use.
- Ask for Cpk/Ppk Data: For statistical analysis, historical process capability data (Cpk or Ppk) for similar features is the gold standard.
- Use Your FAI Reports: The measurement data from your First Article Inspection (FAI) during DVT is a goldmine. Use this real-world data to refine your statistical models before you ramp to mass production. This collaborative process is the heart of effective Design for Manufacturing.
When is a Simple Worst-Case Analysis "Good Enough"?
While statistical methods offer more nuance, worst-case analysis remains the right choice in several key situations:
- For Safety-Critical Interfaces: For medical implants, aerospace flight controls, or automotive safety systems, failure is not an option. The absolute guarantee provided by a worst-case pass is non-negotiable, regardless of statistical improbability.
- For Very Simple Stacks: If your assembly has only two or three components in the stack, the statistical benefit of RSS or Monte Carlo is often minimal. The simplicity and certainty of a worst-case check make it the more efficient choice.
- As an Early Sanity Check: During the concept phase, a quick worst-case calculation can tell you if a design direction is fundamentally flawed before significant engineering hours are invested. A failure here is an immediate signal to rethink the architecture.
At Sheridan Technologies, we view disciplined, data-driven tolerance analysis as fundamental to reducing program risk and delivering complex hardware on time and on budget. If you're facing assembly challenges or want to strengthen your DFM process, our team can help.